


We’d love to hear from you about two specific Metrics topics:
- If you could create your own dashboards/views in Metrics, how would you use this? Per owner? Set of properties? How would you personalize them? Revenue in one view, messaging in another? Imagine you can have any stats on there, not just what’s available in the current Metrics page.
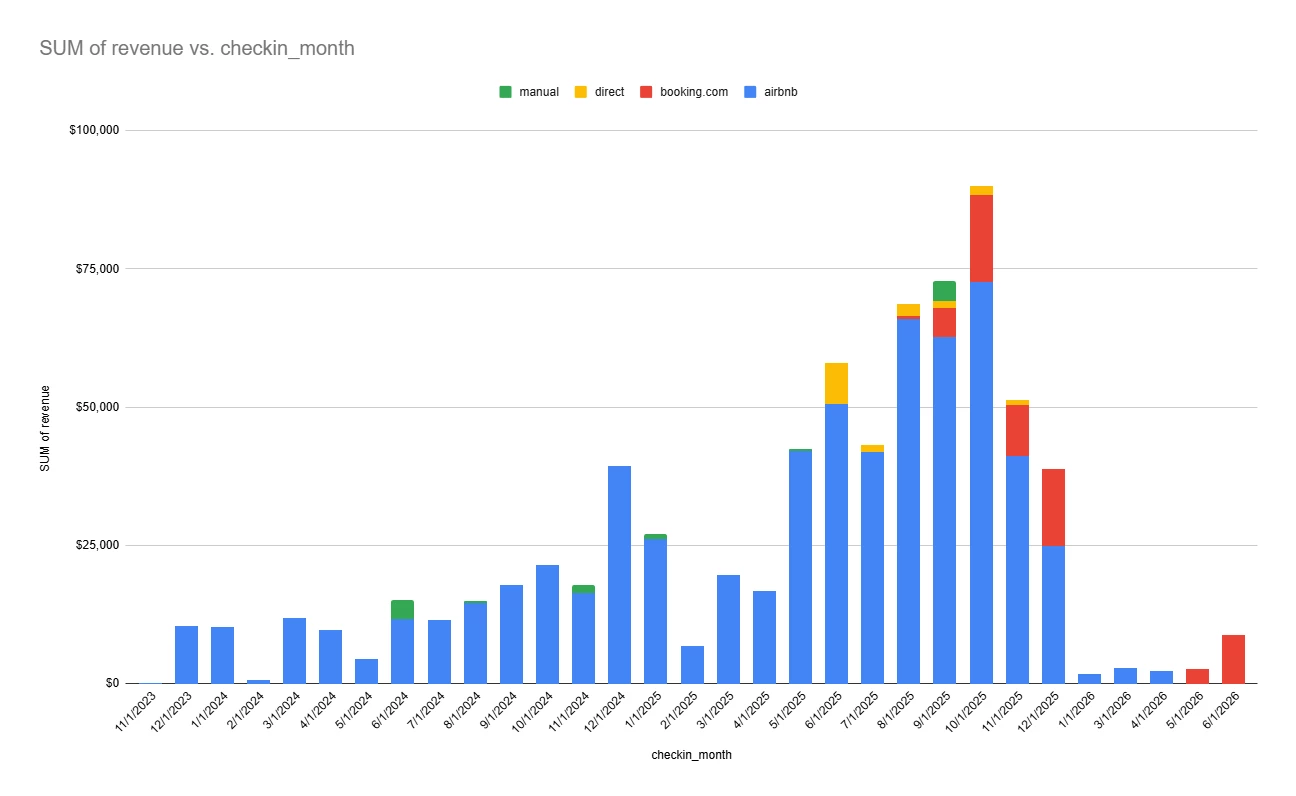
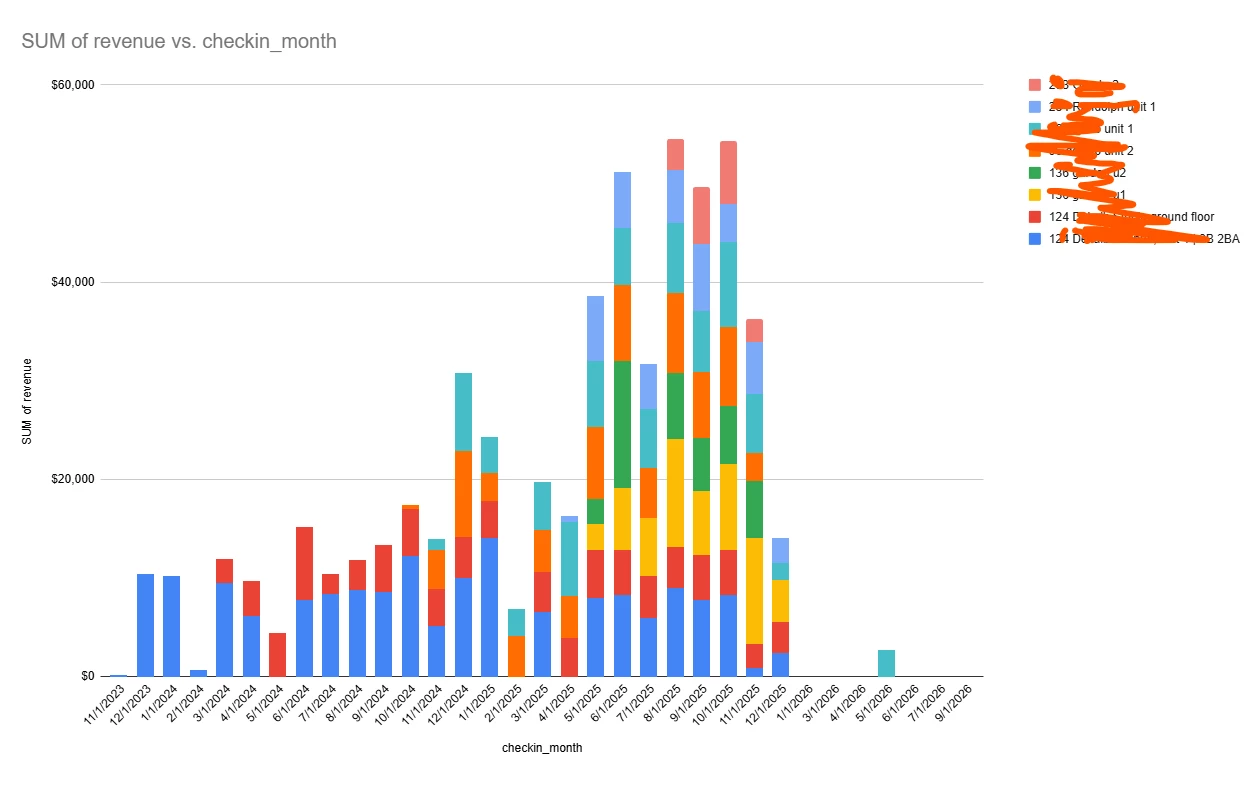
- And related to that, what is some unique number crunching that you’re doing right now using the raw data that you export from Hospitable?